The first day I tried out Shazam, I was blown away. Next to GPS and surviving the fall down a flight of stairs, being able to recognize a song from a vast corpus of audio was the most incredible thing I’d ever seen my phone do. This recognition works though a process called audio fingerprinting. Examples include:
After a few weekends of puzzling through academic papers and writing code, I came up with the Dejavu Project, an open-source audio fingerprinting project in Python. You can see it here on Github:
https://github.com/worldveil/dejavu
On my testing dataset, Dejavu exhibits 100% recall when reading an unknown wave file from disk or listening to a recording for at least 5 seconds.
Following is all the knowledge you need to understand audio fingerprinting and recognition, starting from the basics. Those with signals experience should skip to “Peak Finding”.
Music as a signal
As a computer scientist, my familiarity with the Fast Fourier Transform (FFT) was only that it was a cool way to mutliply polynomials in O(nlog(n)) time. Luckily it is much cooler for doing signal processing, its canonical usage.
Music, it turns out, is digitally encoded as just a long list of numbers. In an uncompressed .wav file, there are a lot of these numbers - 44100 per second per channel. This means a 3 minute long song has almost 16 million samples.
3 min * 60 sec * 44100 samples per sec * 2 channels = 15,876,000 samples
A channel is a separate sequence of samples that a speaker can play. Think of having two earbuds - this is a “stereo”, or two channel, setup. A single channel is called “mono”. Today, modern surround sound systems can support many more channels. But unless the sound is recorded or mixed with the same number of channels, the extra speakers are redundant and some speakers will just play the same stream of samples as other speakers.
Sampling
Why 44100 samples per second? The mysterious choice of 44100 samples per second seems quite arbitrary, but it relates to the Nyquist-Shannon Sampling Theorum. This is a long, mathematical way to say that there is a theoretical limit on the maximum frequency we can capture accurately when recording. This maximum frequency is based on how fast we sample the signal.
If this doesn’t make sense, think about watching a fan blade that makes a full revolution at a rate of exactly once per second (1 Hz). Now imagine keeping your eyes closed, but opening them briefly once per second. If the fan still happens to be making exactly a full revolution every 1 second as well, it will appear as though the fan blade hasn’t moved! Each time you open your eyes, the blade happens to be in the same spot. But there’s a problem. In fact, as far as you know, the fan blade could be making 0, 1, 2, 3, 10, 100, or even 1 million spins per second and you would never know - it would still appear stationary! Thus in order to be assured you are correctly sampling (or “seeing”) higher frequencies (or “spins”), you need to sample (or “open your eyes”) more frequently. To be exact, we need to sample twice as frequently as the frequency we want to see to make sure we’re detecting it.
In the case of recording audio, the accepted rule is that we’re OK missing out on frequencies above 22050 Hz since humans can’t even hear frequencies above 20,000 Hz. Thus by Nyquist, we have to sample twice that:
Samples per sec needed = Highest-Frequency * 2 = 22050 * 2 = 44100
The MP3 format compresses this in order to 1) save space on your hard drive, and 2) irritate audiophiles, but a pure .wav formatted file on your computer is just a list of 16 bit integers (with a small header).
Spectrograms
Since these samples are a signal of sorts, we can repeatedly use an FFT over small windows of time in the song’s samples to create a spectrogram of the song. Here’s a spectrogram of the first few seconds of “Blurred Lines” by Robin Thicke.
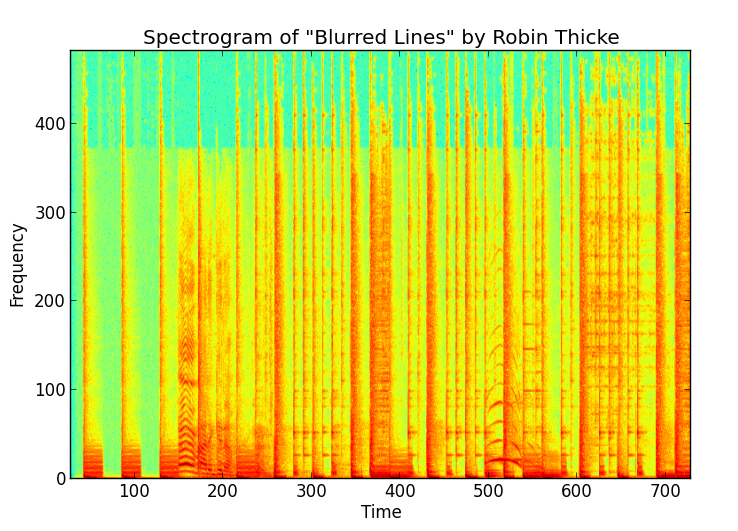
As you can see, it’s just a 2D array with amplitude as a function of time and frequency. The FFT shows us the strength (amplitude) of the signal at that particular frequency, giving us a column. If we do this enough times with our sliding window of FFT, we put them together and get a 2D array spectrogram.
It’s important to note that the frequency and time values are discretized, each representing a “bin”, while the amplitudes are real valued. The color shows the real value (red -> higher, green -> lower) of the amplitude at the discretized (time, frequency) coordinate.
As a thought experiment, if we were to record and create a spectrogram of a single tone, we’d get a straight horizontal line at the frequency of the tone. This is because the frequency does not vary from window to window.
Great. So how does this help us recognize audio? Well, we’d like to use this spectrogram to identify this song uniquely. The problem is that if you have your phone in your car and you try to recognize the song on the radio, you’ll get noise - someone is talking in the background, another car honking its horn, etc. We have to find a robust way to capture unique “fingerprints” from the audio signal.
Peak Finding
Now that we’ve got a specrogram of our audio signal, we can start by finding “peaks” in amplitude. We define a peak as a (time, frequency) pair corresponding to an amplitude value which is the greatest in a local “neighborhood” around it. Other (time, frequency) pairs around it are lower in amplitude, and thus less likely to survive noise.
Finding peaks is an entire problem itself. I ended up treating the spectrogram as an image and using the image processing toolkit and techniques from scipy to find peaks. A combination of a high pass filter (accentuating high amplitudes) and scipy local maxima structs did the trick.
Once we’ve extracted these noise-resistant peaks, we have found points of interest in a song that identify it. We are effectively “squashing” the spectrogram down once we’ve found the peaks. The amplitudes have served their purpose, and are no longer needed.
Let’s plot them to see what it looks like:
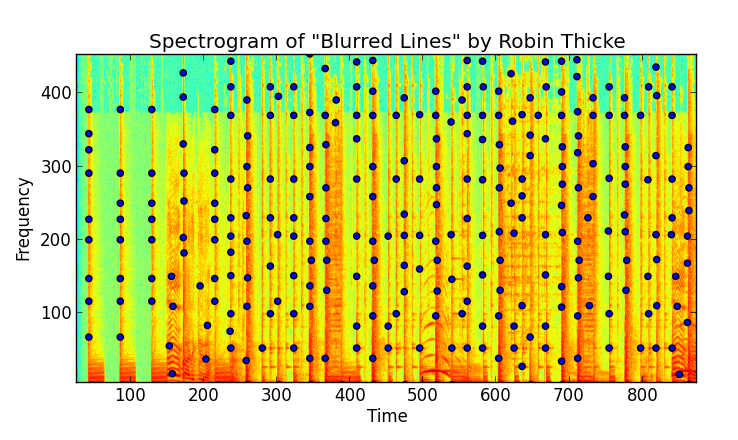
You’ll notice there are a lot of these. Tens of thousands per song, actually. The beauty is that since we’ve done away with amplitude, we only have two things, time and frequency, which we’ve conviently made into discrete, integer values. We’ve binned them, essentially.
We have a somewhat schizophrenic situation: on one hand, we have a system that will bin peaks from a signal into discrete (time, frequency) pairs, giving us some leeway to survive noise. On the other hand, since we’ve discretized, we’ve reduced the information of the peaks from infinite to finite, meaning that peaks found in one song could (hint: will!) collide, emitting the pairs as peaks extracted from other songs. Different songs can and most likely will emit the same peaks! So what now?
Fingerprint hashing
So we might have similar peaks. No problem, let’s combine peaks into fingerprints! We’ll do this by using a hash function.
A hash function takes an integer input and returns another integer as output. The beauty is that a good hash function will not only return the same output integer each time the input is the same, but also that very few different inputs will have the same output.
By looking at our spectrogram peaks and combining peak frequencies along with their time difference between them, we can create a hash, representing a unique fingerprint for this song.
hash(frequencies of peaks, time difference between peaks) = fingerprint hash value
There are lots of different ways to do this, Shazam has their own, SoundHound another, and so on. You can peruse my source to see how I do it, but the point is that by taking into account more than a single peak’s values you create fingerprints that have more entropy and therefore contain more information. Thus they are more powerful identifiers of songs since they will collide less.
You can visualize what is going on with the zoomed in annotated spectrogram snipped below:
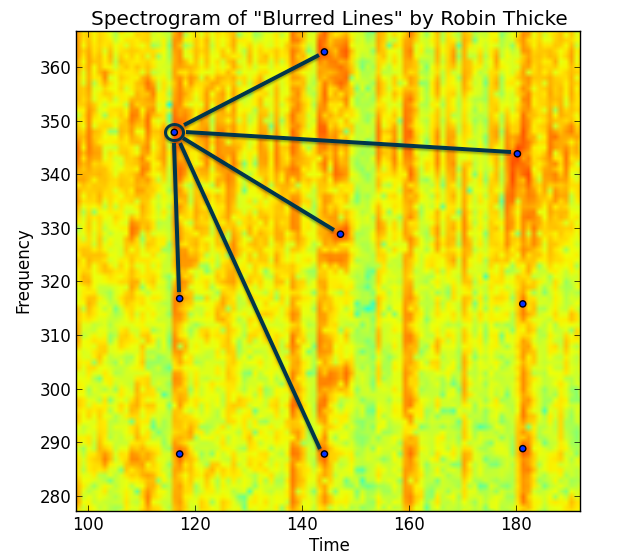
The Shazam whitepaper likens these groups of peaks as a sort of “constellation” of peaks used to identify the song. In reality they use pairs of peaks along with the time delta in between. You can imagine lots of different ways to group points and fingerprints. On one hand, more peaks in a fingerprint means a rarer fingerprint that more strongly would identify a song. But more peaks also means less robust in the face of noise.
Learning a Song
Now we can get started into how such a system works. An audio fingerprinting system has two tasks:
- Learn new songs by fingerprinting them
- Recognize unknown songs by searching for them in the database of learned songs
For this, we’ll use our knowledge thus far and MySQL for the database functionality. Our database schema will contain two tables:
- fingerprints
- songs
Fingerprints table
The fingerprints table will have the following fields:
CREATE TABLE fingerprints (
     hash binary(10) not null,
     song_id mediumint unsigned not null,
     offset int unsigned not null,
     INDEX(hash),
     UNIQUE(song_id, offset, hash)
);
First, notice we have not only a hash and a song ID, but an offset. This corresponds to the time window from the spectrogram where the hash originated from. This will come into play later when we need to filter through our matching hashes. Only the hashes that “align” will be from the true signal we want to identify (more on this in the “Fingerprint Alignment” section below).
Second, we’ve made an INDEX on our hash - with good reason. All of the queries will need to match that, so we need a really quick retrieval there.
Next, the UNIQUE index just insures we don’t have duplicates. No need to waste space or unduly weight matching of audio by having duplicates lying around.
If you’re scratching your head on why I used a binary(10) field for the hash, the reason is that we’ll have a lot of these hashes and cutting down space is imperative. Below is a graph of the number of fingerprints for each song:
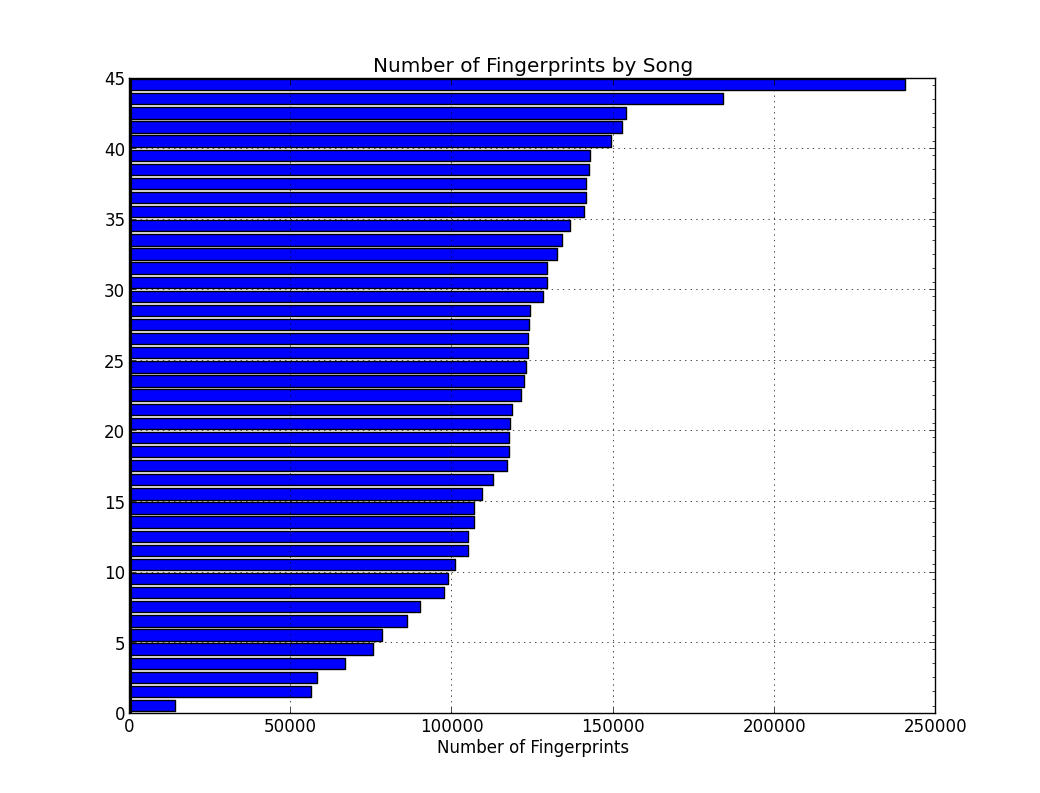
At the front of the pack is “Mirrors” by Justin Timberlake, with over 240k fingerprints, followed by “Blurred Lines” by Robin Thicke with 180k. At the bottom is the acapella “Cups” which is a sparsely instrumented song - just voice and literally a cup. In contract, listen to “Mirrors”. You’ll notice the obvious “wall of noise” instrumentation and arranging the fills out the frequency spectrum from high to low, meaning that the spectrogram is abound with peaks in high and low frequencies alike. The average is well over 100k fingerprints per song for this dataset.
With this many fingerprints, we need to cut down on unecessary disk storage from the hash value level. For our fingerprint hash, we’ll start by using a SHA-1 hash and then cutting it down to half its size (just the first 20 characters). This cuts our byte usage per hash in half:
char(40) => char(20) goes from 40 bytes to 20 bytes
Next we’ll take this hex encoding and convert it to binary, once again cutting the space down considerably:
char(20) => binary(10) goes from 20 bytes to 10 bytes
Much better. We went from 320 bits down to 80 bits for the hash field, a reduction of 75%.
My first try at the system, I used a char(40) field for each hash - this resulted in over 1 GB of space for fingerprints alone. With binary(10) field, we cut down the table size to just 377 MB for 5.2 million fingerprints.
We do lose some of the information - our hashes will, statistically speaking, collide much more often now. We’ve reduced the “entropy” of the hash considerably. However, its important to remember that our entropy (or information) also includes the offset field, which is 4 bytes. This brings the total entropy of each of our fingerprints to:
10 bytes (hash) + 4 bytes (offset) = 14 bytes = 112 bits = 2^112 ~= 5.2+e33 possible fingerprints
Not too shabby. We’ve saved ourself 75% of the space and still managed to have an unimaginably large fingerprint space to work with. Gurantees on the distribution of keys is a hard argument to make, but we certainly have enough entropy to go around.
Songs table
The songs table will be pretty vanilla, essentially we’ll just use it for holding information about songs. We’ll need it to pair a song_id to the song’s string name.
CREATE TABLE songs (
    song_id mediumint unsigned not null auto_increment,
    song_name varchar(250) not null,
    fingerprinted tinyint default 0,
    PRIMARY KEY (song_id),
    UNIQUE KEY song_id (song_id)
);
The fingerprinted flag is used by Dejavu internally to decide whether or not to fingprint a file. We set the bit to 0 initially and only set it to 1 after the fingerprinting process (usually two channels) is complete.
Fingerprint Alignment
Great, so now we’ve listened to an audio track, performed FFT in overlapping windows over the length of the song, extracted peaks, and formed fingerprints. Now what?
Assuming we’ve already performed this fingerprinting on known tracks, ie we have already inserted our fingerprints into the database labeled with song IDs, we can simply match.
Our pseudocode looks something like this:
channels = capture_audio()

fingerprints_matching = [ ]
for channel_samples in channels
    hashes = process_audio(channel_samples)
    fingerprints_matching += find_database_matches(hashes)

predicted_song = align_matches(fingerprints_matching)
What does it mean for hashes to be aligned? Let’s think about the sample that we are listening to as a subsegment of the original audio track. Once we do this, the hashes we extract out of the sample will have an offset that is relative to the start of the sample.
The problem of course, is that when we originally fingerprinted, we recorded the absolute offset of the hash. The relative hashes from the sample and the absolute hashes from the database won’t ever match unless we started recording a sample from exactly the start of the song. Pretty unlikely.
But while they may not be the same, we do know something about the matches from the real signal behind the noise. We know all the relative offsets will be the same distance apart. This requires the assumption that the track is being played and sampled at the same speed it was recorded and released in the studio. Actually, we’d be out of luck anyway in the case the playback speed was different, since this would affect the frequency of the playback and therefore the peaks in the spectrogram. At any rate, the playback speed assumption is a good (and important) one.
Under this assumption, for each match we calculate a difference between the offsets:
difference = database offset from original track - sample offset from recording
which will always yield a postiive integer since the database track will always be at least the length of the sample. All of the true matches with have this same difference. Thus our matches from the database are altered to look like:
(song_id, difference)
Now we simply look over all of the matches and predict the song ID for which the largest count of a difference falls. This is easy to imagine if you visualize it as a histogram.
And that’s all there is to it!
How well it works
To truly get the benefit of an audio fingerprinting system, it can’t take a long time to fingerprint. It’s a bad user experience, and furthermore, a user may only decide to try to match the song with only a few precious seconds of audio left before the radio station goes to a commercial break.
To test Dejavu’s speed and accuracy, I fingerprinted a list of 45 songs from the US VA Top 40 from July 2013 (I know, their counting is off somewhere). I tested in three ways:
- Reading from disk the raw mp3 -> wav data, and
- Playing the song over the speakers with Dejavu listening on the laptop microphone.
- Compressed streamed music played on my iPhone
Below are the results.
1. Reading from Disk
Reading from disk was an overwhelming 100% recall - no mistakes were made over the 45 songs I fingerprinted. Since Dejavu gets all of the samples from the song (without noise), it would be nasty surprise if reading the same file from disk didn’t work every time!
2. Audio over laptop microphone
Here I wrote a script to randomly chose n seconds of audio from the original mp3 file to play and have Dejavu listen over the microphone. To be fair I only allowed segments of audio that were more than 10 seconds from the starting/ending of the track to avoid listening to silence.
Additionally my friend was even talking and I was humming along a bit during the whole process, just to throw in some noise.
Here are the results for different values of listening time (n):

This is pretty rad. For the percentages:
| Number of Seconds | Number Correct | Percentage Accuracy |
|---|---|---|
| 1 | 27 / 45 | 60.0% |
| 2 | 43 / 45 | 95.6% |
| 3 | 44 / 45 | 97.8% |
| 4 | 44 / 45 | 97.8% |
| 5 | 45 / 45 | 100.0% |
| 6 | 45 / 45 | 100.0% |
Even with only a single second, randomly chosen from anywhere in the song, Dejavu is getting 60%! One extra second to 2 seconds get us to around 96%, while getting perfect only took 5 seconds or more. Honestly when I was testing this myself, I found Dejavu beat me - listening to only 1-2 seconds of a song out of context to identify is pretty hard. I had even been listening to these same songs for two days straight while debugging…
In conclusion, Dejavu works amazingly well, even with next to nothing to work with.
3. Compressed streamed music played on my iPhone
Just to try it out, I tried playing music from my Spotify account (160 kbit/s compressed) through my iPhone’s speakers with Dejavu again listening on my MacBook mic. I saw no degredation in performance; 1-2 seconds was enough to recognize any of the songs.
Performance: Speed
On my MacBook Pro, matching was done at 3x listening speed with a small constant overhead. To test, I tried different recording times and plotted the recording time plus the time to match. Since the speed is mostly invariant of the particular song and more dependent on the length of the spectrogram created, I tested on a single song, “Get Lucky” by Daft Punk:
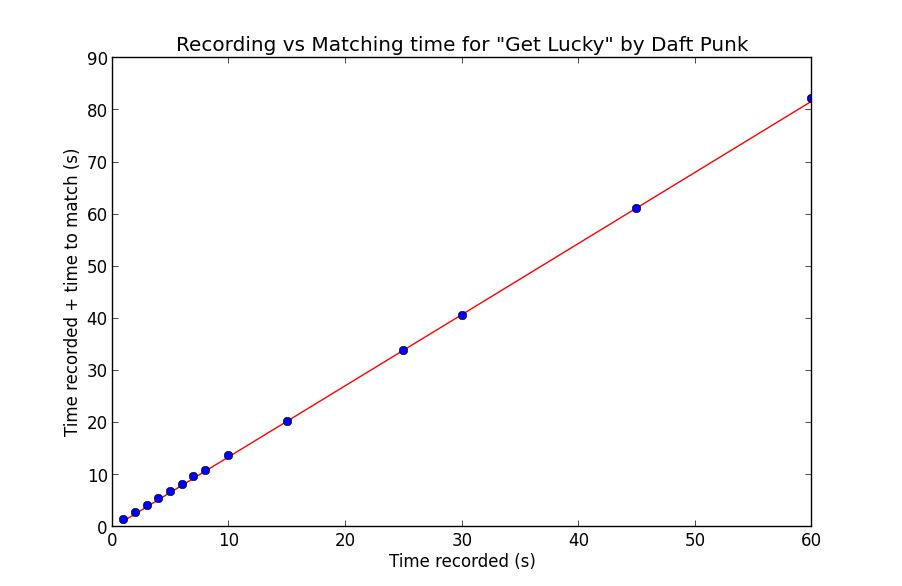
As you can see, the relationship is quite linear. The line you see is a least-squares linear regression fit to the data, with the corresponding line equation:
1.364757 * record time - 0.034373 = time to match
Notice of course since the matching itself is single threaded, the matching time includes the recording time. This makes sense with the 3x speed in purely matching, as:
1 (recording) + 1/3 (matching) = 4/3 ~= 1.364757
if we disregard the miniscule constant term.
The overhead of peak finding is the bottleneck - I experimented with mutlithreading and realtime matching, and alas, it wasn’t meant to be in Python. An equivalent Java or C/C++ implementation would most likely have little trouble keeping up, applying FFT and peakfinding in realtime.
An important caveat is of course, the round trip time (RTT) for making matches. Since my MySQL instance was local, I didn’t have to deal with the latency penalty of transfering fingerprint matches over the air. This would add RTT to the constant term in the overall calculation, but would not effect the matching process.
Performance: Storage
For the 45 songs I fingerprinted, the database used 377 MB of space for 5.4 million fingerprints. In comparison, the disk usage is given below:
| Audio Information Type | Storage in MB |
|---|---|
| mp3 | 339 |
| wav | 1885 |
| fingerprints | 377 |
There’s a pretty direct trade-off between the necessary record time and the amount of storage needed. Adjusting the amplitude threshold for peaks and the fan value for fingerprinting will add more fingerprints and bolster the accuracy at the expense of more space.
It’s true, the fingerprints take up a surprising amount of space (slighty more than raw MP3 files). This seems alarming until you consider there are tens and sometimes hundreds of thousands of hashes per song. We’ve traded off the pure information of the entire audio signal in the wave files for about 20% of that storage in fingerprints. We’ve also enabled matching songs very reliably in five seconds, so our space / speed tradeoff appears to have paid off.
Conclusion
Audio fingerprinting seemed magical the first time I saw it. But with a small amount of knowledge about signal processing and basic math, it’s a fairly accessible field.
My hope is that anyone reading this will check out the Dejavu Project and drop a few stars on me or, better yet, fork it! Check out Dejavu here: